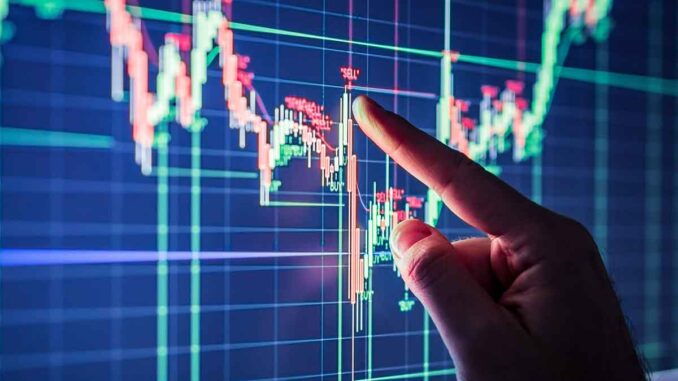
Market Profile is a charting method for short timeframes invented by J. Peter Steidlmayer, a trader at the Chicago Board of Trade (CBT).
The resulting Market profile is a simple tool that plots time/volume vs price, but a provides a lot of information about the market if read properly.
This type of charting was a valuable tool for stock traders of the past decades because by viewing a market profile in real-time it allowed traders to react more quickly to changes in the market without the influence of market news or reports. With the advent of electronic media and mass-trend based reporting, market profiles have almost become meaningless in stock trading.
The situation is different on the still very young crypto markets. The old-school stock analysis tools like Wyckoff method or Market Profile are still valuable in crypto.
So, instead of relying on the popularity and usefulness of this indicator, traders must keep in mind that there are a wide variety of indicators out there, and a wide variety of markets.
What you should look for is a reliable indicator that has been proven to perform over a long period of time, has high accuracy and a money back guarantee.
Another important factor to consider is that there is no “one-size-fits-all” market profile indicator available. Instead, there are indicators for virtually every market situation and market condition and many different possible combinations.
Let’s take a closer look at some of these market profile indicators and how they can be used by traders.
What does a Market Profile chart show?
The opening balance is probably the simplest indicator available and is comprised of a series of trend lines representing the opening and closing balances of a particular currency pair over a given period of time. Usually that time period will be a day.
Traders can plot the opening balance against time to identify any obvious trends or areas of support or resistance.
They can also use the opening balance to determine when to enter a trade and what sizes to set your stop loss and take profit on.
Similarly, POC indicator readings can often be determined by plotting the closing price against certain time frames. POC here stands for point of control.
The considerations about control in a market include arange of market data and its various factors such as fundamental economic data like economic growth reports, interest rates (in banks or on crypto exchanges), general confidence and so on.
Some traders prefer to plot the POC readings against the range of the SMA or Simple Moving Average index, which are typically considered to be a leading indicator over a period of time. Other traders like to plot these against time frames that highlight key turning points in the market’s history such as the tops and bottoms.
An interesting addition could be the ALMA moving average, if you are comfortable with it.
Likewise, the moving average line can be used to detect market participants with strong price activity over a given time frame.
For instance, if you find five heavy buyers in the market during the trading day, you can plot the moving average line against the time frame of the best five market participants.
Likewise, you can identify market participants who have consistently traded in the market and have a consistently strong price action. These are typically long-term players in the market and are usually buying and selling power.
Final words
Analysis of the Market Profile is an old technique that is nonetheless valuable on crypto market, once you get the grips of it.
It is important not to get too caught up in identifying trends and using them as part of your day trading strategy. Short-term goals should be in place and trading styles should be set for achieving those goals. This allows day traders to effectively manage their risk without trading at too high of a frequency.

Leave a Reply
You must be logged in to post a comment.